A busy sidewalk can be misleading. Two blocks may each carry 500 pedestrians an hour, yet one functions as a direct commuter route while the other encourages people to stop, browse, cross, sit, and interact. A simple head count treats those places as identical.
That is why learning how to measure pedestrian movement in urban design research requires more than counting people. Researchers need to capture volume, direction, speed, routes, dwell time, street conditions, and sometimes pedestrian perceptions.
The best studies combine several methods and then connect observed behavior to the physical design of the street.
Start With the Question, Not the Technology
Before installing sensors or opening GIS software, define what the research must explain.
A retail district study may ask whether storefront design increases foot traffic. A transportation study might examine peak-hour crossing demand. A plaza project may care more about lingering, seating, group behavior, and movement paths.
Those questions require different measurements.
The Federal Highway Administration defines pedestrian volume as the number of people walking past a location during a specified period. Its monitoring guidance also recognizes that short-duration and continuous measurements serve different purposes.
A useful research plan normally separates four questions:
- How many pedestrians are present?
- Where and in which direction are they moving?
- How long do they remain in particular places?
- What physical or experiential conditions may explain that behavior?
Once those questions are clear, selecting instruments becomes much easier.
The Main Ways to Measure Pedestrian Movement
Researchers rarely need every available technique. The method should match the spatial scale, budget, study duration, and required precision.
| Method | Best for | Main limitation |
| Manual gate counts | Footfall and directional volume | Labor-intensive |
| Behavioral mapping | Routes, lingering and public-space use | Difficult at very high volumes |
| Automated counters | Long-term trends | May misclassify groups or users |
| Video/computer vision | Trajectories, speed and conflicts | Privacy and processing requirements |
| GPS/Wi-Fi/Bluetooth data | Route and dwell-time patterns | Sampling and privacy bias |
| GIS/network analysis | Accessibility and built-form relationships | Models potential rather than observed behavior |
| Street audits/surveys | Comfort and perceived walkability | Subjective responses |
Manual Counts Still Matter
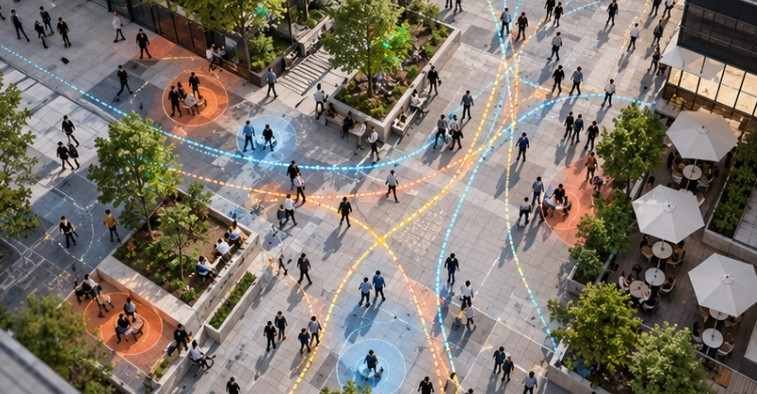
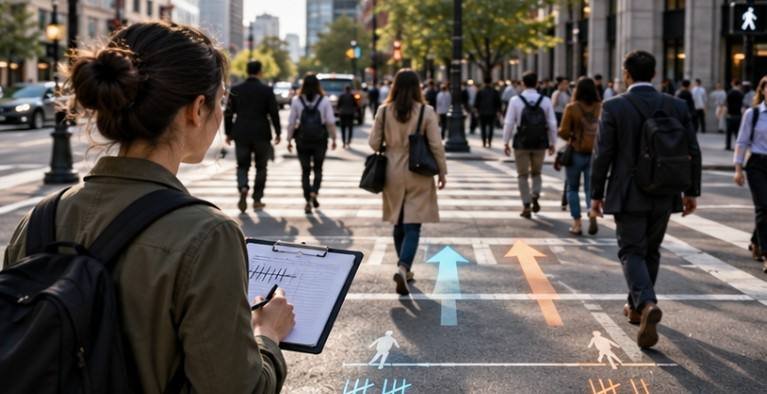
The simplest method remains surprisingly useful. Place an imaginary “gate” across a sidewalk or crosswalk and count everyone crossing it during fixed intervals, such as 15 minutes. Separate the tally by direction if directional flow matters.
FHWA guidance identifies sidewalks, crosswalks, and transit stations as typical pedestrian-count locations.
Rather than observing only one rush hour, sample several periods: morning, midday, evening, weekday, and weekend. Weather, school schedules, sporting events, transit disruption, and seasonal conditions can dramatically change walking activity.
The Pedestrian and Bicycle Information Center recommends combining short-duration counts with permanent or continuous counters because together they reveal both spatial and temporal variation.
Map Movement Instead of Merely Counting It
A gate count tells you that 420 people passed a corner. It does not tell you what those people actually did.
Behavioral mapping fills that gap.
Researchers use a base map and record walking paths, crossings, stops, seating locations, informal shortcuts, waiting areas, group activity, and places where people turn around.
Repeated traces often reveal patterns that drawings never predict.
A beautifully designed entrance may attract little use because it sits outside the natural desire line. Pedestrians may repeatedly cross outside the marked crosswalk because their destination lies diagonally opposite. A wide plaza may contain one narrow strip where almost everyone walks.
For each observation period, record:
- route or trajectory;
- direction;
- approximate walking speed;
- stopping location;
- dwell time;
- group size; and
- unusual behaviors such as shortcutting or avoiding an area.
The result becomes a movement map rather than a spreadsheet of totals.
Use Sensors for Longer Observation Periods
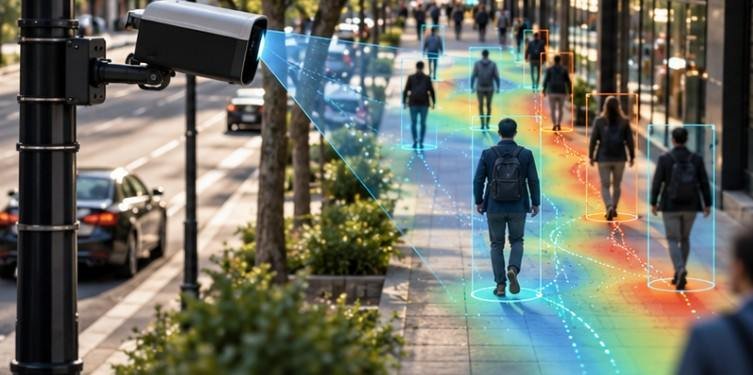
Automated pedestrian counters become valuable when researchers need days, months, or years of information.
Infrared, thermal, optical, radar, LiDAR, and video-based systems can measure pedestrian volumes continuously. Computer-vision systems can go further by estimating direction, trajectories, speeds, and interactions.
FHWA notes that video processing can distinguish pedestrians and bicyclists, including groups, although lighting and weather can reduce accuracy.
That limitation matters. Automated data should be validated against manual observations before researchers assume the numbers are correct.
Researchers should also establish privacy rules before collecting identifiable video, device identifiers, or detailed location traces. Collect only the resolution necessary to answer the research question.
Add GIS to Explain the Pattern
Observed movement becomes much more useful after it is connected with urban form.
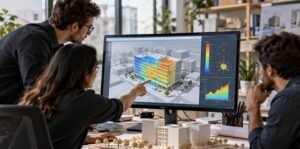
GIS layers can compare pedestrian activity against intersection density, transit stops, land-use mix, block length, sidewalk networks, destinations, building entrances, crossings, tree cover, and other environmental variables.
EPA’s National Walkability Index methodology, for example, incorporates street intersection density, proximity to transit, and land-use diversity to characterize relative walkability across U.S. block groups.
These variables help explain why one corridor attracts more walking than another, but researchers should not confuse modeled walkability with observed pedestrian activity. A GIS model estimates environmental potential. Counts show what actually happened.
Careful layer management is equally important. Researchers working across architectural and computational workflows can apply the same file-discipline principles used to prepare architectural CAD files for digital fabrication when cleaning spatial layers, naming datasets, checking coordinates, and removing duplicate geometry.
Measure the Street People Experience

Movement patterns are partly explained by what pedestrians encounter at eye level.
The CDC’s Built Environment Assessment Tool provides a structured way to examine sidewalks, curb ramps, intersections, crossings, traffic controls, transit access, recreational facilities, and other walkability characteristics.
Researchers can supplement these audits with observations of shade, seating, storefront transparency, lighting, sidewalk obstructions, traffic buffers, active ground-floor uses, and perceived safety.
Evidence published by the American Planning Association illustrates urban design and pedestrian activity why this matters. Research discussed by planner Reid Ewing found relationships between pedestrian activity and variables such as density, land-use diversity, active uses, continuous frontage, and ground-floor transparency. In other words, street geometry explains only part of pedestrian behavior.
Common Measurement Mistakes
The biggest mistake is treating one afternoon of counting as representative pedestrian demand.
Another is studying only peak volume. NACTO recommends evaluating street performance across several periods rather than allowing an extremely short peak interval to define overall operation.
Researchers should also avoid comparing raw crash totals without considering exposure. FHWA notes that pedestrian volume, crossings, travel distance, and travel time can all be used as exposure measures in pedestrian safety analysis.
Finally, sensors do not automatically make research better. A carefully designed manual study can answer a focused question more reliably than millions of poorly interpreted location records.
Frequently Asked Questions
1. What is the simplest way to measure pedestrian movement?
Use manual gate counts at selected sidewalks or crossings during standardized time intervals. Record direction and repeat observations at different times and days.
2. How long should pedestrian counts last?
It depends on the research question. Short counts can identify spatial differences, while multi-day or continuous monitoring is better for understanding daily, weekly, and seasonal variation.
3. Can GIS measure pedestrian movement directly?
Usually not. GIS primarily explains spatial conditions and accessibility. Combine GIS variables with observed counts, GPS traces, sensors, or behavioral mapping to study actual movement.
4. Why measure pedestrian dwell time?
Dwell time distinguishes spaces people merely pass through from places where they stop, socialize, shop, wait, or rest, revealing qualities that simple footfall counts miss.
What the Numbers Should Ultimately Reveal
The most valuable pedestrian research does not end with a statement such as “742 people walked past this corner.”
It explains why they selected that corner, where they came from, where they went, when activity changed, where movement became uncomfortable, and how the physical environment influenced those decisions.
That is the real purpose of how to measure pedestrian movement in urban design research: turning ordinary walking behavior into evidence designers can use. Count people, map their choices, document the street around them, and compare those observations over time. The sidewalk itself will usually reveal more about successful urban design than the plan drawing ever could.