A site can quietly make a promising architectural idea impossible before the first floor plan is finished. A floodplain can change the buildable footprint, one mature tree can redirect circulation, and a zoning setback can eliminate the massing concept that looked perfect in studio.
That is why learning how to conduct a site analysis for architecture research is less about collecting impressive-looking maps and more about discovering which conditions should influence design decisions.
A strong analysis connects four things: what regulations permit, what the land physically does, how people experience the place, and how those findings affect the project.
Start With Questions, Not Graphics
Before opening GIS software or producing a sun-path diagram, define what you need to learn.
Ask whether the proposed program fits the parcel, which edges offer useful access, where environmental hazards exist, how neighboring buildings influence privacy and daylight, and which site characteristics deserve protection.
Cornell University’s landscape architecture site-planning framework emphasizes identifying and evaluating both on-site and adjacent systems rather than examining a parcel in isolation. That distinction matters because traffic, drainage, views, shade, community patterns, and ecological systems rarely stop at a property boundary.
Build the Base Map Before Visiting the Property
The field visit should confirm and deepen your research, not begin it.
Start with parcel boundaries, surrounding streets, nearby structures, topography, water features, transit, vegetation, and recognizable landmarks. Historical imagery can also reveal removed buildings, former land uses, altered drainage patterns, or vegetation changes that are invisible today.
Verify Zoning and Legal Limits Early
For a US project, investigate the municipality’s current zoning map and ordinance. Record the zoning district, permitted uses, height restrictions, setbacks, lot coverage, parking rules, floor-area limits, overlays, historic controls, and any special review requirements.
Do not confuse preliminary online mapping with a boundary survey or legal determination. Property lines, easements, rights-of-way, and title restrictions may eventually require verification by qualified professionals.
This is one of the most important limitations of student-level or early architectural research: a visually convincing site-analysis drawing is not a substitute for legal documentation.
Read the Land in Three Dimensions
Topographic information should tell you more than whether a parcel is “flat” or “sloped.”
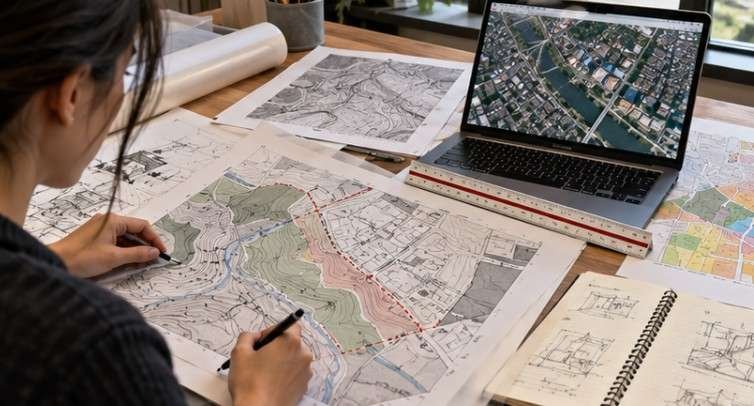
The US Geological Survey explains that contour lines represent the shape and elevation of terrain while topographic maps can also identify roads, water bodies, vegetation, boundaries, and significant built features. USGS’s National Map for topographic research, downloadable topographic and geospatial information for US sites.
Look for high and low points, slope direction, abrupt grade changes, retaining conditions, probable drainage routes, and relationships between the parcel and adjacent land.
Add Climate and Hazard Research Before Designing
A sunny site photograph taken at 2 p.m. in October tells you almost nothing about annual solar performance.
Study seasonal sun angles, prevailing winds, temperature ranges, precipitation, humidity, and extreme weather exposure. NOAA’s current US climate normals use the 1991–2020 period as the standard 30-year climate baseline, making them much more useful than relying on a few recent weather observations.
The AIA also recommends studying seasonal wind, solar paths, soil and rock conditions, severe weather exposure, water behavior, and existing ecosystems early enough for those findings to influence design
Flood risk deserves particular attention. FEMA’s Map Service Center is the official source for National Flood Insurance Program flood-hazard information, including Flood Insurance Rate Maps and National Flood Hazard Layer data.
Conduct the Site Visit Like an Investigator
A site visit should capture conditions that desktop research cannot fully describe.
Walk the perimeter first. Compare visible boundaries, fences, sidewalks, utilities, driveways, curb cuts, vegetation, and buildings with your base map. Photograph each edge rather than concentrating only on the center of the parcel.
Then move through the property several times from different directions.
Record slope changes, wet areas, erosion, retaining walls, mature trees, rock formations, existing structures, drainage infrastructure, utility equipment, pavement, desire paths, shaded areas, and evidence of previous land use.
Do not ignore sensory information. Note traffic noise, mechanical equipment, aircraft, school activity, industrial odors, glare, privacy conditions, attractive views, unpleasant views, and places where people naturally gather.
Time also changes the site. A downtown corner at 8 a.m. may behave differently at 10 p.m. If the research matters to a real project, consider repeat observations during different hours or days.
Turn Site Data Into Design Evidence
This is where many analyses become decorative rather than useful.
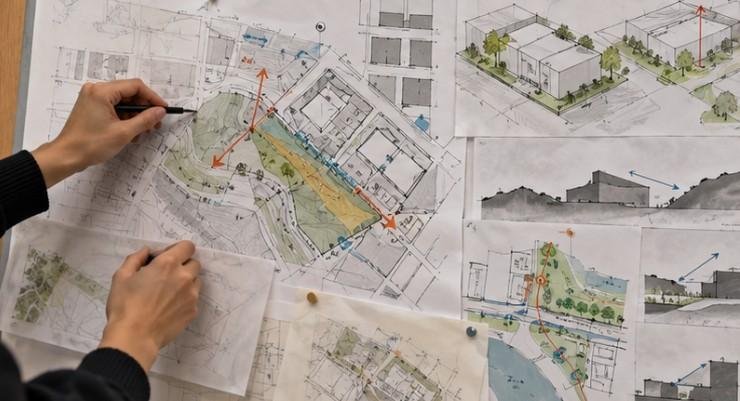
Instead of drawing every dataset onto one complicated plan, separate information into clear analytical layers.
| Analysis layer | What to document | Design question it should answer |
| Topography | contours, slopes, drainage, low points | Where should building levels and stormwater strategies respond to grade? |
| Climate | sun, shade, wind, rainfall | Which orientations improve daylight, comfort, and passive performance? |
| Movement | vehicles, pedestrians, bikes, transit, service access | Where should entrances and circulation occur? |
| Context | massing, land use, views, noise, privacy | Which edges should open, buffer, connect, or protect? |
| Regulation | setbacks, height, FAR, easements | What is realistically buildable? |
| Ecology | vegetation, soil, water, habitat | What should be retained, restored, or disturbed minimally? |
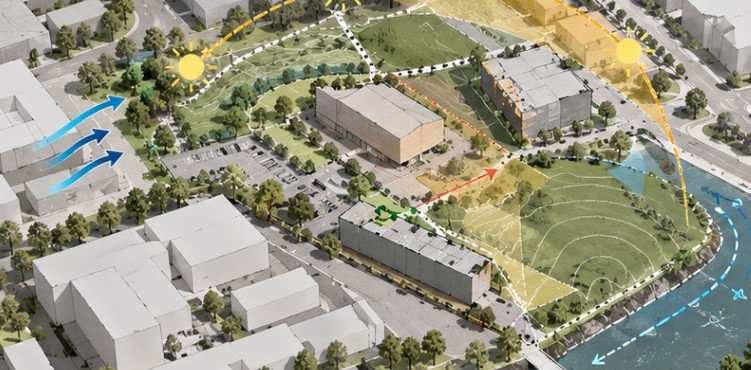
Create figure-ground studies for built and open space, section drawings for topography, arrows for circulation and wind, solar overlays, view cones, noise gradients, and separate opportunity-and-constraint diagrams.
Keep graphic conventions consistent. A diagram should answer a question within seconds, not make the reviewer decode twenty colors.
If you are later developing the visual character of the proposal, principles such as using color theory in architectural design can help translate contextual research into a more intentional material and visual strategy.
Convert Every Important Observation Into a Design Question
The real value of how to conduct a site analysis for architecture research appears during synthesis.
Suppose a parcel slopes toward its western boundary. Simply writing “site slopes west” is inventory.
Analysis asks what that means.
Could the building step with the terrain instead of requiring extensive excavation? Does runoff collect along that edge? Could the lower area support landscape-based stormwater management? Would an entrance there create accessibility problems?
The same method works socially.
If pedestrians consistently cut diagonally across an unused corner, do not immediately treat them as trespassers. Their movement may reveal a missing connection that should influence circulation.
A surrounding architectural language can also become research evidence rather than a style rule. Understanding topics such as why Brutalist architecture remains popular demonstrates how material, context, history, and public perception can influence how buildings are read.
Use an Opportunity–Constraint–Response Test
Before finalizing your analysis, take every major finding and classify it three ways.
An opportunity is a condition the project could benefit from, such as winter solar exposure, a transit stop, mature shade trees, or a valuable view.
A constraint is something that limits options, such as flood risk, traffic noise, difficult grade, contamination, or a restrictive setback.
A response explains the architectural consequence.
For example: “Heavy traffic along the southern edge” is a constraint. “Place service spaces along the southern edge while orienting frequently occupied rooms toward the quieter courtyard” is a design response.
If your research contains dozens of observations but almost no responses, the analysis is unfinished.
Common Site-Analysis Mistakes
More data does not automatically create better architectural research.
Avoid trusting satellite imagery as proof of current conditions, treating generalized GIS boundaries as surveyed property lines, studying only the parcel while ignoring its neighborhood, or presenting climate data without connecting it to orientation and massing.
Another misconception is that site analysis ends when schematic design begins.
The AIA’s Framework for Design Excellence places site analysis and hazard assessment in pre-design but also encourages continued testing as design develops. New information from consultants, surveys, community engagement, engineering, or environmental investigation should be allowed to change earlier assumptions.
Frequently Asked Questions
1. What should an architecture site analysis include?
Include zoning, parcel conditions, topography, climate, drainage, vegetation, circulation, neighboring buildings, utilities, views, noise, hazards, social activity, opportunities, constraints, and the design implications of those findings.
2. How long should site analysis take?
There is no fixed duration. A student exercise may take days, while professional projects may require weeks of surveys, environmental studies, engineering research, code investigation, and stakeholder consultation.
3. Can Google Earth replace an architectural site visit?
No. Aerial imagery is valuable for preliminary context research, but it cannot reliably capture current noise, odors, pedestrian behavior, small grade changes, vegetation condition, drainage problems, or temporary activities.
4. Why are diagrams important in site analysis?
Diagrams convert large amounts of raw information into spatial relationships. They make patterns, conflicts, opportunities, and constraints easier to recognize and connect directly to architectural decisions.
Final Perspective
The strongest site analysis is not the one with the most arrows, maps, photographs, or data layers. It is the one that makes the eventual design feel difficult to imagine anywhere else.
Learning how to conduct a site analysis for architecture research therefore means moving repeatedly from evidence to implication: verify the regulations, understand the terrain, observe people, study climate and hazards, diagram relationships, and then ask what each discovery should change. By the time you begin serious massing, the site should no longer look like an empty boundary on a plan. It should already be telling you where the architecture needs to respond.