
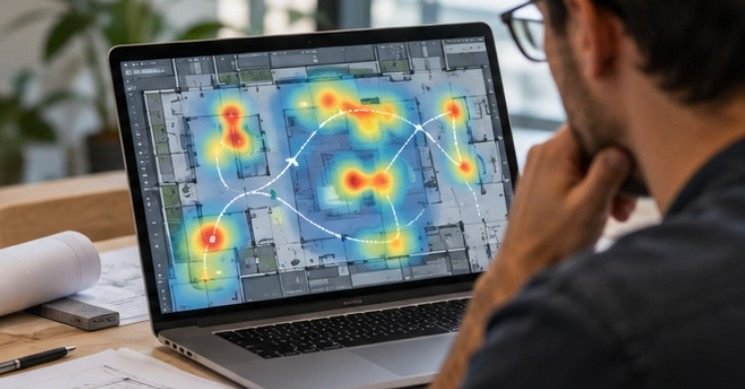
A floor plan can show where a corridor sits, but it cannot reveal where people hesitate, which bench stays empty, or why everyone cuts across a lobby instead of following the intended route. Those mismatches between design intent and lived use are exactly what behavior mapping makes visible.
For researchers learning how to conduct behavior mapping in architectural research, the method is straightforward: systematically observe people, record their locations and activities on a spatial map, repeat the observations under comparable conditions, and examine whether recurring behaviors correspond with features of the environment.
What Behavior Mapping Actually Measures
Behavior mapping connects visible human activity to physical space. Researchers document where people sit, stand, walk, wait, socialize, work, play, or interact with architectural elements.
A 2023 review of behavior-mapping research examined 353 publications and conducted bibliometric analysis on 123 journal articles. It found that researchers have moved beyond paper-and-pencil mapping to include video, GPS, GIS, sensors, mobile technology, and immersive environments.
Yet the fundamental principle remains unchanged: a behavior becomes useful architectural evidence only when researchers know where and when it occurred.
This makes the technique valuable for post-occupancy evaluations, hospitals, universities, workplaces, libraries, parks, transit facilities, and public spaces. The U.S. General Services Administration’s workplace evaluation guidance similarly incorporates space-utilization data and post-occupancy analysis into workplace planning.
Begin With a Question, Not an Empty Floor Plan
Trying to record every visible action usually creates clutter rather than useful evidence.
Start with one or two questions that observation can realistically answer. A library study might ask whether students favor perimeter seating. A hospital study could investigate whether staff make unnecessary trips because supplies are poorly located. A plaza study might examine whether shade or movable furniture changes dwell time.
Next, choose the appropriate mapping approach.
Place-Centered Mapping
Place-centered research focuses on one defined environment. At scheduled intervals, the observer records what everyone within that space is doing.
It works particularly well for courtyards, waiting rooms, classrooms, parks, lobbies, cafeterias, and work areas.
Person-Centered Tracking
Person-centered mapping follows an anonymized individual or user category through a space. Researchers can record routes, pauses, backtracking, detours, destinations, and time spent at different locations.
The Design Society’s behavioral mapping method emphasizes using a top-down drawing together with behaviors defined before observations begin.
That preparation reduces subjective decisions during fieldwork.
Build a Coding System That Observers Can Actually Use
Start with an accurate but visually clean floor plan or site plan. Include entrances, furniture, circulation routes, fixed equipment, landscape elements, and observation boundaries.
Then create simple behavioral codes.
| Record | Example | What It Reveals |
| User type | staff, student, visitor | differences among groups |
| Activity | sitting, walking, waiting | patterns of space use |
| Location | zone or mapped point | relationship to design |
| Time | timestamp or interval | changes through the day |
| Condition | shade, noise, occupied furniture | possible environmental influences |
Pilot the coding sheet for 20–30 minutes before beginning formal observations. Remove categories that observers interpret differently and retain only variables relevant to the research question.
A code such as “social interaction,” for example, needs an operational definition. Does two people sitting together count, or must they visibly communicate? Deciding beforehand makes later comparisons more defensible.
Observe More Than One Moment in Time

Building use is rarely static. Occupancy can shift with class schedules, staff changes, weather, daylight, meal periods, special events, and weekday-versus-weekend patterns. Therefore, one busy afternoon should not automatically represent normal behavior.
Research published by the CDC on direct observation in public spaces demonstrates the value of systematic sampling. One park study observed different seasons, weekdays and weekends, and several daylight periods rather than relying on a single visit.
Architectural researchers need not duplicate that schedule, but they should capture the variations most likely to affect their particular site.
Use Repeated Sweeps
Every 10 or 15 minutes, scan the same zones in the same sequence and record everyone who meets the study criteria.
This method works well for measuring occupancy, seating preferences, clustering, waiting, and activity distribution.
Track Movement Continuously
For circulation questions, trace users from origin to destination.
Movement lines can expose shortcuts, bottlenecks, backtracking, unnecessary travel, pauses, cross-traffic conflicts, and routes that occupants consistently avoid.
Check Observer Reliability Before Collecting Everything
When several researchers are involved, each should receive identical behavioral definitions, maps, symbols, and examples.
Run a test session in which two observers independently record the same scene. Compare their results, identify disagreements, refine definitions, and repeat the exercise.
Reliability matters. A CDC review comparing five observational park-audit instruments found considerable differences among the tools while reporting moderate-to-good inter-rater reliability for all five.
Privacy deserves equal attention. Video, identifiable photographs, precise movement histories, vulnerable users, and observations in sensitive environments may require additional ethical safeguards. Collect only the personal information genuinely necessary and consult the appropriate Institutional Review Board when applicable.
Convert Observation Marks Into Architectural Evidence
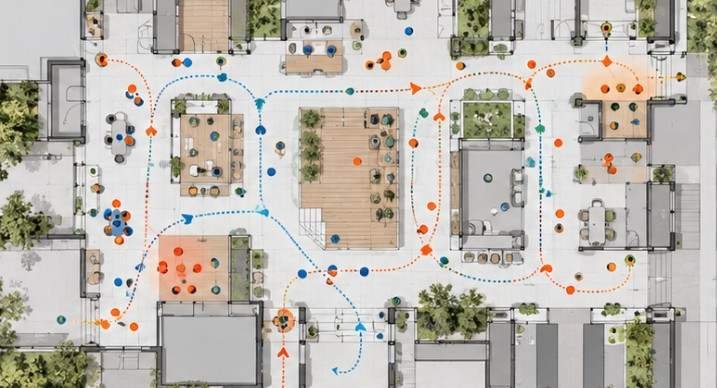
After fieldwork, transfer the observations into CAD, GIS, or another digital mapping environment.
Three visual outputs are especially useful.
Density maps reveal repeated concentrations of people. Flow maps show major routes, crossings, detours, and circulation conflicts. Dwell maps distinguish spaces people simply pass through from locations where they voluntarily remain.
The next step is more important than producing the graphic: explain the pattern.
A popular location might offer better daylight, visual control, acoustic protection, comfortable furniture orientation, shade, electrical outlets, or convenient proximity to entrances.
Cornell University researchers have used behavioral mapping across human-centered and healthcare design research. Cornell’s Human Centered Design program identifies behavior mapping among its research interests, demonstrating how closely environmental design and behavioral observation can overlap.
Healthcare research illustrates the depth possible. One rehabilitation study accumulated 1,150 observation points in an existing ward and 1,200 after relocation, allowing researchers to compare patient location, activity, and social interaction rather than relying on impressions from occasional walkthroughs.
Apply a Four-Question Interpretation Test
Before converting a mapped pattern into a design recommendation, ask:
- Does the behavior appear repeatedly across observation periods?
- Is it consistently associated with a physical condition?
- Could staffing, scheduling, weather, policy, or another variable explain it?
- Could the proposed architectural change introduce a new problem?
This protects researchers from confusing correlation with causation.
An unused seating area might have poor sightlines, for example, but it could equally be uncomfortable during afternoon sun. Moving furniture without investigating the second explanation would solve the wrong problem.
The observation tradition associated with William H. Whyte remains instructive. Project for Public Spaces documents Whyte’s public-space research, which used direct observation and time-lapse photography to study how people actually occupied urban spaces.
The enduring lesson is simple: observe actual use before prescribing improvements.
Pair Behavior Mapping With Other Research Methods

Behavioral maps become more informative when combined with interviews, short surveys, environmental measurements, space-syntax analysis, or post-occupancy evaluation.
Observation establishes what happened. Those complementary methods can help establish why.
For research connecting human behavior with environmental performance, mapped observations can also complement a life-cycle assessment of local building materials or a biophilic interior architecture daylighting simulation. Together, these methods provide different layers of evidence about how buildings perform environmentally and experientially.
The CDC Built Environment Assessment Tool is another useful methodological reference because it emphasizes measurable physical features, observer training, systematic data collection, and consistent analysis.
Know What Behavior Mapping Cannot Tell You
Behavior mapping is strong at recording observable actions, but it does not automatically reveal motivation, emotion, satisfaction, or cultural meaning.
Someone sitting beside an exit might prefer daylight, dislike noise, be waiting for transportation, or simply have chosen the first available chair.
Researchers may therefore need interviews or surveys before attributing motives to visible patterns.
Technology has limits too. Cameras, GPS trackers, and sensors may produce larger datasets, but they also introduce privacy, consent, storage, accuracy, and interpretation concerns. More data is not necessarily better research.
Frequently Asked Questions
1. What is behavior mapping in architecture?
It is a structured observational method that records where people move, remain, interact, or perform activities and connects those behaviors with particular spatial conditions.
2. How long should behavior mapping observations last?
There is no universal duration. Researchers should sample enough periods to capture meaningful variation across peak times, quieter periods, days, weather, events, or operational schedules.
3. Can behavior mapping be conducted digitally?
Yes. Tablets, GIS, CAD, GPS, video, sensors, and mobile forms can support mapping when they suit the research question and comply with privacy requirements.
4. What is the biggest mistake when learning how to conduct behavior mapping in architectural research?
Using too many poorly defined behavioral categories. Fewer, clearly observable codes generally produce more consistent data and make spatial patterns easier to interpret.
Final Takeaway
Learning how to conduct behavior mapping in architectural research is ultimately less about producing impressive heatmaps and more about creating a repeatable chain of evidence. Define a precise question, establish observable codes, sample meaningful time periods, test observer consistency, map recurring patterns, and challenge alternative explanations before recommending changes.
Architecture often fails quietly: a shortcut through landscaping, a congested doorway, a chair nobody chooses. Behavior mapping turns those quiet signals into usable evidence. The strongest map does not simply show where people were—it reveals where design deserves another look.