

Sourcing stone or timber within a 50-mile radius feels inherently sustainable, but proximity does not guarantee a low carbon footprint. Conducting a rigorous life cycle assessment of local building materials reveals that transportation accounts for only a fraction of total environmental impact. Extraction methods, regional electric grid emissions, processing efficiency, and durability often outweigh the mileage saved.
During my early spec reviews on commercial builds, I routinely favored regional suppliers over national vendors. I assumed geography settled the carbon question. It took a deep dive into standardized environmental product declarations to realize that local quarrying can generate more emissions than clean-grid alternatives shipped from hundreds of miles away.
Evaluating regional materials requires quantitative verification rather than assumptions. You must understand where emissions hide, how to establish defensible system boundaries, and how to verify third-party data.
The Fallacy of the Local Mileage Shortcut
The common assumption that “closer is greener” overlooks manufacturing energy intensity. Transportation emissions (Module A4 in standard accounting) typically contribute between 4% and 12% of a material’s upfront embodied footprint. The extraction of raw resources (A1) and industrial refinement (A3) account for the dominant share.
If a local masonry block manufacturer relies on an inefficient kiln powered by heavy fossil fuel oil, their baseline embodied carbon spikes. Conversely, a producer three states away operating on high-blend renewable electricity and utilizing industrial heat recovery can deliver materials with a substantially smaller net profile.
When you prioritize proximity without auditing product lifecycle performance, you risk locking carbon into the building envelope. Genuine sustainability requires empirical accounting across every phase of production.
Setting Boundaries: Cradle-to-Gate vs. Cradle-to-Grave
Accurate reporting begins with standard protocols. The foundation of any reliable study adheres to ISO 14040/14044 standards, which define principles and frameworks for comparative lifecycle reporting. Without strict parameters, comparisons fall apart.
Defining the Functional Unit Correctly
A lifecycle comparison fails if the functional units are mismatched. You cannot compare one cubic yard of regional rammed earth directly to one cubic yard of structural concrete. They perform different structural duties, carry disparate compressive loads, and provide varying thermal resistance values.
Instead, define the functional unit by service performance over time: one square foot of external wall assembly achieving an R-value of 20 with a structural service life of 60 years. This approach factors in necessary secondary components, such as moisture barriers, furring strips, and replacement cycles.
Tracking Stages A1 Through A5
For local materials, focus heavily on upfront impacts. Standards developed by the Carbon Leadership Forum emphasize upfront embodied carbon—Modules A1 through A5—because these emissions enter the atmosphere before the building opens:
- A1 (Raw Material Supply): Clearing, mining, or harvesting at the source.
- A2 (Transport to Manufacturer): Intermediate hauling logistics.
- A3 (Manufacturing): Processing, milling, mixing, curing, and packaging.
- A4 (Transport to Site): The local delivery radius.
- A5 (Construction Installation): On-site equipment, assembly energy, and direct material wastage.
A complete cradle-to-grave study also tracks use phases (B1–B7) and end-of-life deconstruction or recycling pathways (C1–C4, plus module D recovery benefits). For regional supply chains, early wins concentrate in stages A1 through A3.
Testing the Data: An On-Site Material Audit

To verify how this plays out in practice, I conducted a comparative audit between two structural options for a municipal project: locally quarried dimensional limestone versus an engineered regional timber system sourced 450 miles away.
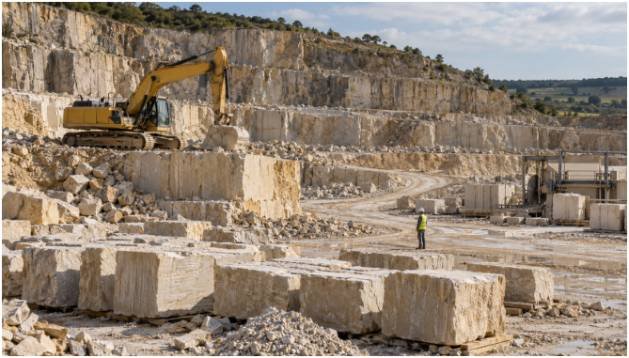
The limestone site sat just 28 miles from the project foundation. The quarry operated antiquated, un-electrified diesel extractors, burning roughly 18 gallons of off-road fuel per ton of finished block. Furthermore, the local municipal electricity grid drew power primarily from regional coal generation.
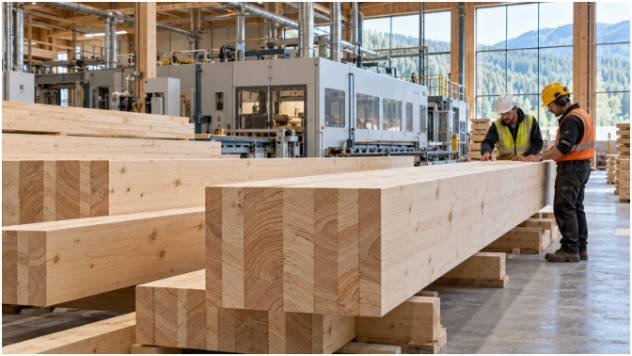
The timber alternative came from an FSC-certified forest and saw timber mill powered by clean grid hydro-power, transporting glulam beams via high-efficiency freight rail.
When I compiled the data through environmental modeling tools aligned with the National Institute of Standards and Technology BEES framework, the results surprised our design team. Despite the 422-mile difference in transit, the timber assembly produced 38% less upfront embodied carbon per functional unit than the local stone. Proximity could not compensate for carbon-intensive extraction and an inefficient supply grid.
Quantifying Embodied Carbon in Regional Supply Chains

Evaluating building products requires accessing plant-specific Environmental Product Declarations (EPDs). An EPD serves as an audited nutritional label for environmental metrics, tracking Global Warming Potential (GWP) measured in kilograms of CO2 equivalent (kgCO2e).
Federal purchasing initiatives and green building programs now reward verified EPDs. The U.S. Environmental Protection Agency continues to expand its focus on transparent industrial reporting, incentivizing clean manufacturing across concrete, asphalt, glass, and steel sectors.
When evaluating local vendors who lack published product-specific EPDs, you must compile primary supply inputs:
- Grid Emission Factors: Determine the regional electric grid mix supplying the fabrication facility.
- Thermal Energy Sources: Document on-site natural gas, propane, or biomass combustion volumes per batch.
- Transport Modes: Differentiate between heavy-duty single-unit trucks, articulated bulk haulers, and freight rail.
- Processing Losses: Factor in scrap rates during custom regional fabrication.
Practical Bottlenecks in Secondary Data Sourcing
The biggest hurdle in assessing local products is the data gap. Large multinational building product manufacturers possess the capital to commission comprehensive third-party verified Type III EPDs. Small, regional lumber mills, brick kilns, and aggregate yards rarely have these documents available.
When local data is unavailable, specifiers default to generic industry-average databases. Using industry averages removes the competitive advantage of an exceptionally clean local artisan mill. It can penalize low-impact local operators whose actual emissions run far below national baselines.
Overcoming this bottleneck requires partnering directly with regional fabricators. By helping them inventory their direct fuel usage, electricity draw, and annual output, design teams can construct baseline life cycle inventories. This collaborative approach preserves regional character while safeguarding the integrity of your carbon budget.
Frequently Asked Questions About Material Life Cycle Assessment
1. What are the main benefits of conducting an LCA on regional building materials?
It proves whether buying local actually lowers your project’s embodied carbon footprint and prevents greenwashing assumptions.
2. How does transportation distance affect the total life cycle assessment score?
Transportation typically accounts for less than 15% of a building material’s total emissions, meaning manufacturing energy carries far more weight.
3. Can small regional producers afford verified Environmental Product Declarations?
Third-party verification remains costly, but emerging industry group EPDs and low-cost digital calculation tools are lowering financial barriers for small vendors.
4. What is the most reliable tool for calculating building material LCA?
Recognized platforms include Tally, One Click LCA, and open-access frameworks aligned with Athena Impact Estimator and NIST databases.
Stop Guessing and Run the Balance Sheet
Regional pride cannot substitute for verified carbon metrics. If you want your projects to achieve authentic net-zero performance, test every material choice against life cycle accounting principles.
Request raw energy and transit data from your local distributors. Audit the grid emissions feeding their shops. Compare their verified global warming potential against long-distance, clean-manufactured options using identical functional units.
When you let real data dictate specifications, your material selections will back up their sustainability claims with measurable results.