

A city can reveal one of its most important design problems after nearly every detail has been removed from the map.
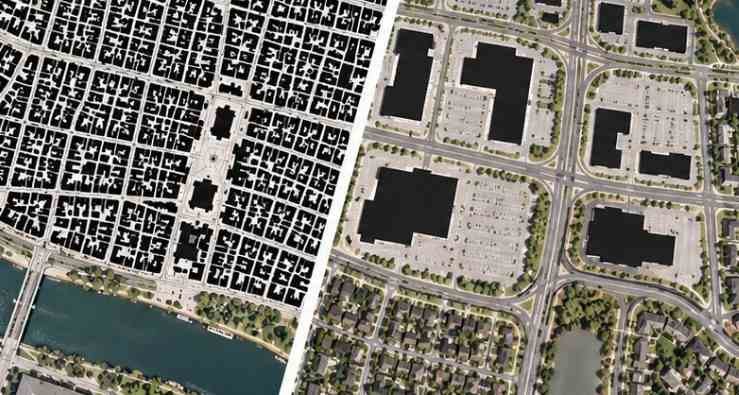
Strip away street names, property labels, trees, traffic, building heights, and architectural styles. Fill every building footprint in black and leave everything else white. Suddenly, continuous street walls, oversized parking fields, broken blocks, hidden courtyards, and isolated buildings become difficult to ignore.
That visual simplification explains how to use figure ground analysis in urban design research: not merely to produce an attractive diagram, but to investigate how built mass shapes streets, public space, movement, density, and neighborhood character.
What a Figure-Ground Map Actually Reveals
Figure-ground analysis reduces urban form to two basic conditions. Buildings become the figure, traditionally represented as dark solids or poché, while streets, plazas, parks, yards, courtyards, and other unbuilt areas become the ground.
The method is powerful precisely because it removes distractions.
Instead of asking whether buildings are attractive, researchers can ask more fundamental questions. Do buildings form recognizable blocks? Are streets spatially enclosed? Is open space intentionally shaped, or does it appear to be leftover land between detached objects?
MIT teaching materials on city-form comparison typologies ranging from London squares and Parisian boulevards to Barcelona blocks, superblocks, and German housing patterns, illustrating how dramatically different relationships between buildings and open space produce different urban structures.
That makes figure-ground mapping particularly useful for comparing American downtowns, streetcar-era neighborhoods, suburban commercial corridors, campuses, industrial districts, and redevelopment sites.
Start With a Research Question, Not a Map
A common mistake is drawing the diagram first and deciding what it means afterward. Start with a specific question. You might investigate whether redevelopment has weakened a historic street wall, whether a transit station sits within a walkable urban fabric, or whether vacant and underused parcels could reconnect fragmented blocks.
Then choose a study boundary appropriate to that question.
| Working scale | Best suited to studying | What to examine |
| About 500 meters | Neighborhood or immediate site context | Frontages, setbacks, alleys, courtyards, block edges |
| About 1,000 meters | District relationships | Parks, transit, major streets, institutional sites |
| 2,000 meters or more | Larger urban patterns | Centers, suburbs, superblocks, development transitions |
These distances are useful research windows rather than rigid planning standards. A half-mile study area may be appropriate around a transit station but too large for investigating one courtyard or block.
Build a Reliable Base Map
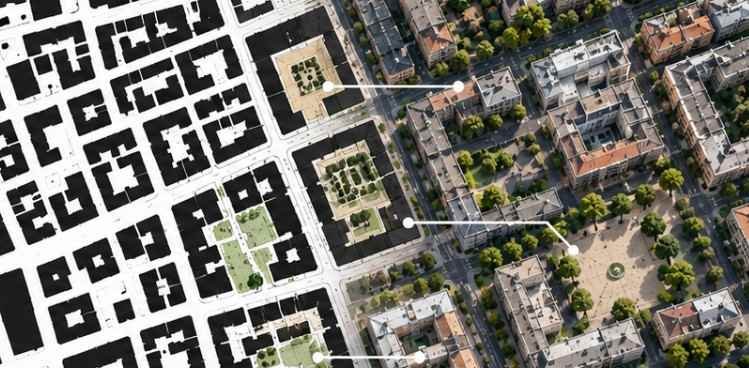
Gather footprints and street geometry
For U.S. research, begin with the best building-footprint dataset available from the municipality, county, or state. Local GIS portals often provide considerably more detailed building polygons than national datasets.
The U.S. Census Bureau’s TIGER/Line Shapefiles are useful for roads, boundaries, census geography, and other spatial features. They can also be connected with demographic information through geographic codes.
USGS’s National Map provides another useful reference source for transportation, boundaries, elevation, imagery, and selected structures. Researchers should note that its National Structures Dataset primarily represents structures as points rather than comprehensive building-footprint polygons, so it should not automatically replace local footprint data.
QGIS, ArcGIS, AutoCAD, or vector-graphics software can then be used to clean and render the geometry.
Add time as another research layer
A figure-ground map becomes considerably more informative when the same place is compared across decades.
The Library of Congress holds an extraordinary collection of Sanborn Maps Collection covering thousands of North American communities. These maps document building outlines and other property information at a detailed scale, making them valuable for studying changes in historic U.S. urban fabric.
A 1920s commercial district, for example, may reveal closely spaced storefronts where a present-day map shows one large footprint surrounded by parking. That comparison turns a simple diagram into evidence of morphological change.
Draw the Solid-Void Relationship Consistently
For a conventional diagram, render buildings as solid black and leave exterior open space white. Avoid adding shadows, textures, labels, landscaping, or decorative graphics unless they serve a separate analytical layer.
Consistency matters more than visual sophistication.
Researchers can also produce a modified version inspired by Nolli-style mapping. Publicly accessible interior spaces—arcades, transit concourses, civic halls, covered passages, or institutional courtyards—can receive a third graphic treatment.
This is useful when legal property boundaries do not accurately describe how people experience public space.
Read the Pattern Like Evidence
Learning how to use figure ground analysis in urban design research depends less on making the diagram than on knowing what to interrogate after it exists.
Examine grain
Fine-grained areas usually contain numerous small building footprints, parcels, entrances, and closely spaced blocks. Coarse-grained districts contain larger footprints, superblocks, campuses, malls, warehouses, or freestanding towers.
Neither pattern is automatically good or bad. A hospital campus requires different building forms from a traditional main street.
The research question is whether the grain supports the area’s intended function and pedestrian experience.
Test street-edge continuity
Trace each important street and look at how consistently building fronts define it. Continuous frontage can form a strong spatial edge. Large setbacks and surface parking create a very different relationship between pedestrians and buildings.
EPA guidance on smart location mapping resources emphasizes compact building patterns, walkable neighborhoods, interconnected streets, and development directed toward existing communities. Its built-environment mapping resources also note that urban form influences transportation choices.
Look for positive and residual space
Now mentally reverse the map. Ignore the black buildings and study only the white spaces. Can you identify streets, plazas, courtyards, and parks as distinct forms?
If open areas have recognizable boundaries, buildings may be actively shaping public space. If the white space simply flows around isolated objects and parking lots, the ground may be residual rather than intentionally enclosed.
Turn the Diagram Into Measurable Research
Avoid stopping at statements such as “the neighborhood feels fragmented.”
Measure what you see.
Researchers can calculate building coverage, block size, intersection density, average setbacks, street-wall continuity, open-space proportion, or the percentage of frontage occupied by surface parking.
Then compare two places or two historical periods.
For example, if a former industrial district is undergoing adaptive reuse in architecture, a historical figure-ground comparison may reveal whether reused structures preserve the original block pattern or whether new construction dissolves it.
A useful five-question audit is simple: Are blocks clearly defined? Are major streets spatially enclosed? Is the building grain consistent or abruptly disrupted? Does public space form recognizable shapes? Where do gaps interrupt otherwise continuous urban fabric?
Those questions turn visual observations into defensible research findings.
Do Not Ask the Diagram to Explain Everything
Figure-ground analysis has an important limitation: two spaces that look identical in white may function completely differently.
A lively public square, fenced vacant lot, private courtyard, freeway, lawn, and surface parking lot can all appear as “ground.”
The diagram also does not reveal building height, use, ownership, pedestrian volumes, tree canopy, accessibility, socioeconomic conditions, or whether a street is comfortable to walk along.
That is why strong urban research combines figure-ground mapping with land-use data, sections, photographs, transit information, field observation, demographics, historical mapping, and public-space analysis.
EPA’s smart-growth framework reinforces this broader view by connecting development form with transportation, environmental performance, economic conditions, and community quality of life.
From Analysis to Urban Design Decisions
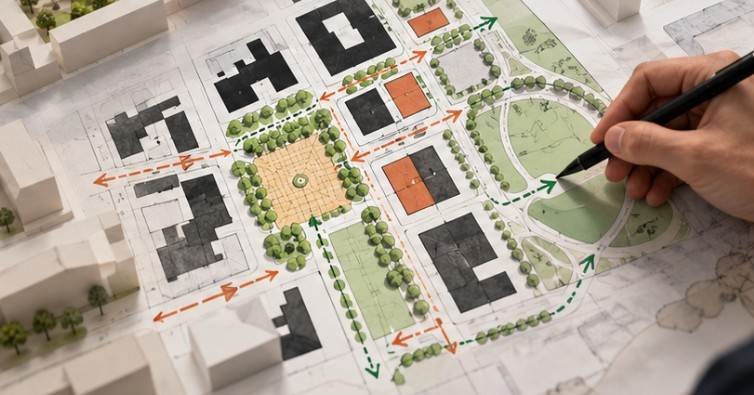
The real value of figure-ground research appears when observations influence design.
A broken street wall might suggest targeted infill rather than wholesale redevelopment. An oversized block could reveal opportunities for a pedestrian passage. A poorly defined civic open space might need stronger building edges rather than simply more landscaping.
Likewise, a historic courtyard network may deserve preservation even if conventional parcel analysis overlooks it.
The point is not to make every district dense or force every street into the same pattern. The goal is to understand the spatial logic that already exists before deciding what should change.
Frequently Asked Questions
1. What is figure-ground analysis in urban design?
It is a mapping method that represents buildings as solid figures and surrounding open space as ground, helping researchers study urban grain, street edges, blocks, public spaces, and development patterns.
2. How do I use figure ground analysis in urban design research effectively?
Define a question and study boundary, map accurate building footprints, examine solid-void relationships, measure key patterns, compare locations or historical periods, and verify conclusions with additional urban data.
3. What software can create a figure-ground map?
QGIS and ArcGIS work well with GIS datasets. AutoCAD is useful for precise drafting, while Illustrator or similar vector software can refine presentation after spatial analysis is complete.
4. Is figure-ground analysis enough for evaluating walkability?
No. It reveals spatial form but not traffic speeds, sidewalks, crossings, land uses, accessibility, shade, safety, or pedestrian activity. Walkability research requires additional street-level and behavioral evidence.
What the Black-and-White Map Should Leave You With
The brilliance of figure-ground analysis is that an intentionally incomplete map can expose relationships hidden inside a detailed one.
I would treat the final diagram as the beginning of interpretation rather than the final product. Mark the interrupted street walls. Measure unexplained gaps. Compare old and new maps. Investigate why one courtyard feels deliberate while another open area feels abandoned.
A strong figure-ground study does not simply say where buildings exist. It explains how buildings collectively make—or fail to make—the spaces of the city.