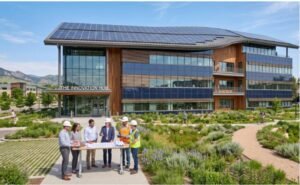

On paper, the high-performance commercial tower I audited last winter was an environmental masterclass. It carried a projected energy use intensity (EUI) of 32 kBtu/sq.ft/year and featured triple-glazed curtain walls alongside state-of-the-art variable air volume terminal units.
Three months after occupancy, the primary meters told an entirely different story. The building consumed 44% more electricity than our energy modeling predicted, while tenant hot-and-cold complaint tickets flooded the property management desk daily.
Executing a rigorous post occupancy evaluation of sustainable building performance is the only reliable diagnostic method to close this divide. Real buildings do not behave like calibrated energy models because mathematical simulations assume static occupant habits, faultless sequence controls, and perfect commissioning. Through direct field evaluations, I bridge the space between theoretical architectural design and raw operational reality.
The Performance Gap: Why Modeled Green Buildings Drift
The performance gap is not a rare defect; it is an industry default. When an eco-certified building starts operating, mechanical systems, controls, and end-users rarely align without direct intervention.
Uncovering Discrepancies Between Energy Models and Field Truth
Design models rely on static assumptions. An energy model inputs an exact occupant schedule, uniform plug-load consumption, and textbook thermostat overrides. Real humans behave unpredictably. Occupants bring personal space heaters, override automated lighting zones, and wedge open balanced fire doors to circulate air.
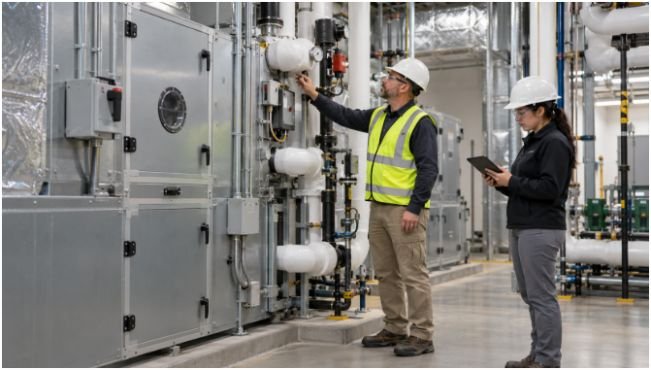
During my on-site evaluations, I frequently observe Building Automation Systems (BAS) operating in permanent manual override. A facility manager, hurried by a wave of cold-zone complaints during move-in week, overrides a variable-frequency drive on an air handler to run at 100% capacity around the clock.
The building continues burning baseline kilowatts all night long. Without an organized performance evaluation, these manual overrides remain frozen in the software for years, silently destroying the building’s operational efficiency.
Modern sustainable construction must move beyond static compliance toward dynamic, living systems. While forward-thinking practitioners increasingly rely on regenerative design frameworks to conceptualize buildings as active ecological assets, those concepts fail if the physical handover lacks empirical verification.
My 4-Phase Diagnostic Framework for Field Audits
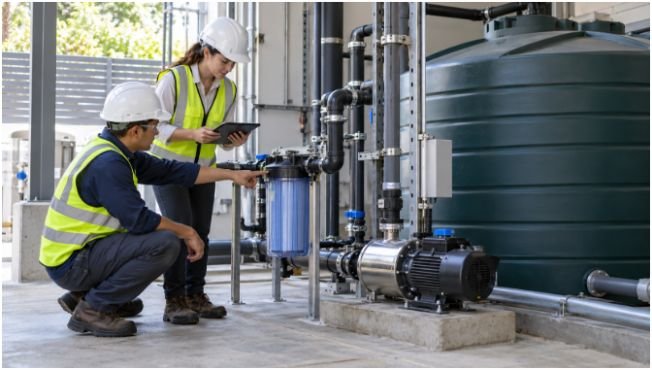
I implement a four-phase post-occupancy workflow derived from standardized protocols developed by the U.S. General Services Administration (GSA). To capture meaningful seasonal data, this sequence starts roughly nine months after substantial completion once initial occupancy levels stabilize.
Phase 1: Operational Baseline Alignment
The diagnostic process begins before touching a sensor. I extract the original energy model output files, MEP engineering specifications, and as-built architectural plans.
Next, I calculate the building’s Simulation-Reality Drift Factor (SRDF). By indexing the design target EUI against the rolling 90-day utility receipts, I establish a baseline drift percentage.
If actual consumption exceeds modeled targets by more than 15%, the audit flags specific subsystems—chillers, domestic pumps, and lighting circuits—for isolated sub-meter logging.
Phase 2: Sensor Deployment and Data Harvesting
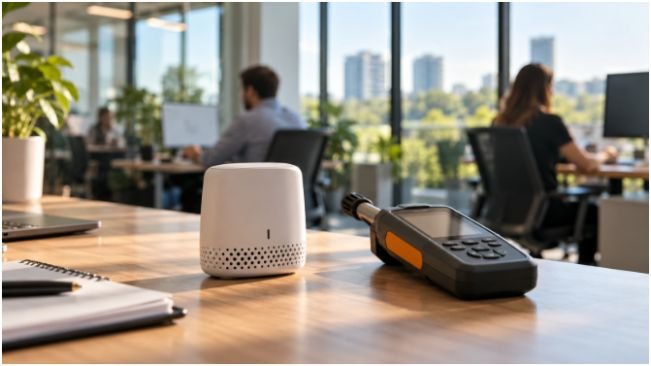
Spot-checking wall thermostats provides inadequate data. Instead, I install calibrated, battery-operated logging pods at breathing height (4 feet above the finished floor) across multiple interior thermal zones.
Zone Log: Core Open Office vs. Perimeter Glazing (Winter Cycle)
Setpoint Target: 71.0°F | 40% RH | <800 ppm CO2
Timestamp Zone Temp (°F) RH (%) CO2 (ppm) VAV Damper Pos
—————————————————————————-
08:00 AM Zone A (Core) 68.2 31% 490 100% (Open)
11:30 AM Zone A (Core) 74.6 28% 1120 15% (Choked)
02:15 PM Zone B (Perim) 67.1 33% 840 90% (Open)
04:45 PM Zone B (Perim) 66.4 35% 780 100% (Hunting)
These data points expose hidden operational failures. High carbon dioxide levels in choked zones indicate under-ventilation during peak meeting hours. Meanwhile, erratic damper movements along the exterior glass expose thermal hunting caused by perimeter drafts.
Physical resource audits must also assess fluid infrastructure. Evaluating a facility’s rainwater harvesting system design in real-world conditions frequently reveals blocked sediment traps, faulty pump switches, or undersized retention tanks that quietly divert costly municipal tap water to flush toilets.
Phase 3: The BUS Methodology Survey Correlation
Objective physical data explains what mechanical systems are doing, but subjective user surveys explain why energy spikes happen. I run standardized surveys based on the Building Use Studies (BUS) framework to capture quantifiable user sentiment.
Occupants rank thermal satisfaction, perceived indoor air quality, glare levels, and acoustic privacy on a 1-to-7 scale. I plot these satisfaction metrics directly against timestamped environmental sensor streams.
In one diagnostic study, afternoon acoustic dissatisfaction in an open-plan office reached 78%. Cross-referencing this complaint spike against our ambient logs revealed that workers were running personal desk fans to generate white noise, masking the echoes of an uninsulated conference wall.
Those small, unmetered fans simultaneously threw off localized wall thermostats, tricking overhead cooling boxes into dumping cold air into already shivering offices.
Phase 4: Systems Recalibration and Low-Cost Fixes
Comprehensive evaluations do not end with an analytical report; they deliver an immediate operational punch-list. Over 80% of identified performance discrepancies can be resolved without major capital outlays:
- Reprogramming HVAC startup routines to pre-heat spaces with outside air dampers closed.
- Recalibrating drifted optical carbon dioxide and temperature sensors across high-density conference rooms.
- Adjusting solar blind automation thresholds to eliminate early afternoon specular glare without forcing occupants to switch on overhead LED banks.
- Resetting hydronic pumping differential pressure setpoints to match actual terminal box resistance rather than theoretical engineering design limits.
Linking Field Diagnostics to LEED v4.1, BREEAM, and WELL
Sustainable certification programs no longer permit developers to earn a plaque based purely on design promises and walk away.
Upgrading from Modeled Intent to Operational Verification
Modern iterations of LEED, specifically LEED v4.1 Operations and Maintenance (O+M), demand ongoing sub-meter data verification. Energy and water consumption must be uploaded directly to digital tracking platforms to maintain an active certification status.
BREEAM In-Use integrates evaluation mechanics into its core assessment standard by scoring operational facilities on asset performance alongside management policies over multi-year cycles.
Similarly, the WELL Building Standard mandates direct on-site physical verification by an accredited testing agent. Before WELL grants performance sign-off, an independent auditor measures photopic lux levels, particulate matter (PM2.5), and acoustic reverberation times in occupied workspaces.
A systematic performance review bridges these certification paths, generating the verified empirical datasets necessary to satisfy third-party auditors and avoid greenwashing claims.
The Split-Incentive Trap and the Reality of Capital Retrofits
Systematic building evaluations face a persistent commercial obstacle: split incentives. In typical triple-net commercial leases, the property owner pays for initial construction and mechanical engineering, while the tenant pays monthly utility invoices. Owners hesitate to fund comprehensive diagnostic audits when the resulting energy savings flow directly to their tenants’ balance sheets.
Overcoming this requires reframing the return on investment. Unchecked operational drift degrades critical capital equipment. Chillers operating under uncalibrated pressure thresholds cycle short, burning out costly compressors years ahead of their scheduled replacement lifecycle. Poor indoor air quality and erratic temperatures accelerate tenant churn and reduce leasing renewals.
By presenting evaluation findings as an asset preservation and tenant retention strategy, sustainability consultants can turn theoretical green ideals into bottom-line financial gains.
Stop Trusting Renderings—Start Interrogating Meters

A pristine sustainability certification on an office lobby wall means very little if the chillers fight each other on winter mornings. True environmental stewardship happens in mechanical rooms, sensor logs, and honest tenant feedback forms months after the ribbon-cutting ceremony.
Treat your building as an evolving, operational ecosystem. Schedule your post-occupancy walk-through nine months after occupancy, inspect your BMS logs for unapproved manual overrides, and calibrate your mechanical infrastructure against real human habits.
Frequently Asked Questions
1. When should a post occupancy evaluation of sustainable building performance begin?
Audits should initiate 6 to 12 months post-handover to allow occupancy patterns, interior outfitting, and seasonal mechanical loads to normalize.
2. What is the difference between an indicative and a diagnostic POE?
An indicative evaluation uses quick walkthroughs and basic utility bill reviews, whereas a diagnostic evaluation deploys calibrated environmental sensors and thorough statistical surveys to pinpoint root-cause equipment failures.
3. How does POE contribute to ESG compliance?
It replaces estimated theoretical carbon values with auditable, metered utility and operational data required for formal corporate ESG disclosures.
4. Does an operational evaluation require expensive physical equipment?
Most performance gaps can be uncovered using existing smart sub-meters, temporary battery-powered temperature loggers, and digital survey tools.